







Woodworking
12.10.2026


 0
 0
 Touch operator panels Weintek
 Meters-indicators
 Controllers (PID, ON/OFF)
 I/O modules

I/O modules
 Spark protection barrier

Spark protection barrier
 Recorders and archivers

Recorders and archivers
 Meters and converters of electrical network parameters

Meters and converters of electrical network parameters
 Counters, timers, tachometers

Counters, timers, tachometers
 Liquid level indicators and regulators

Liquid level indicators and regulators
 Programmed logical controllers

Programmed logical controllers
 Manual signal transmitters

Manual signal transmitters
 Technological signaling devices

Technological signaling devices
 Power supplies

Power supplies
Codesys PLC controllers
Codesys PLC controllers
 Normalizing converters

Normalizing converters
Galvanic isolation and branching blocks
Galvanic isolation and branching blocks
 Communication interface converters and amplifiers

Communication interface converters and amplifiers
 Analytical instruments

Analytical instruments
 Switching blocks

Switching blocks
Control and protection units
Control and protection units
 GSM communication routers / modems

GSM communication routers / modems
Woodworking
12.10.2026
Author
Volodymyr Kapustiak, Microl Engineering LLC
E-mail: asutp@microl.ua
This article presents the practical experience of Tarkett Vinisin LLC (Kalush, Ukraine), where systems for monitoring the microclimate, power consumption and production equipment efficiency have been implemented step by step. The collected data is used to track downtime, productivity and product quality, and to calculate OEE, AGrade, specific energy consumption and production losses. The solutions are built on Microl equipment, Weintek HMI/IIoT devices and the CODESYS software environment. Design, programming, equipment integration, installation and commissioning were carried out by Microl Engineering LLC.
A modern industrial enterprise needs more than automatic control of its process equipment. To improve efficiency, it must understand how that equipment actually performs: how much energy it consumes, where downtime occurs, what losses it causes, how much product is made and of what quality. That is why energy monitoring, production data collection and analysis, and Smart Manufacturing systems have become one of the key directions in industrial automation (Fig. 1). A practical example of this approach is a set of projects implemented at Tarkett Vinisin LLC using equipment and software solutions from:
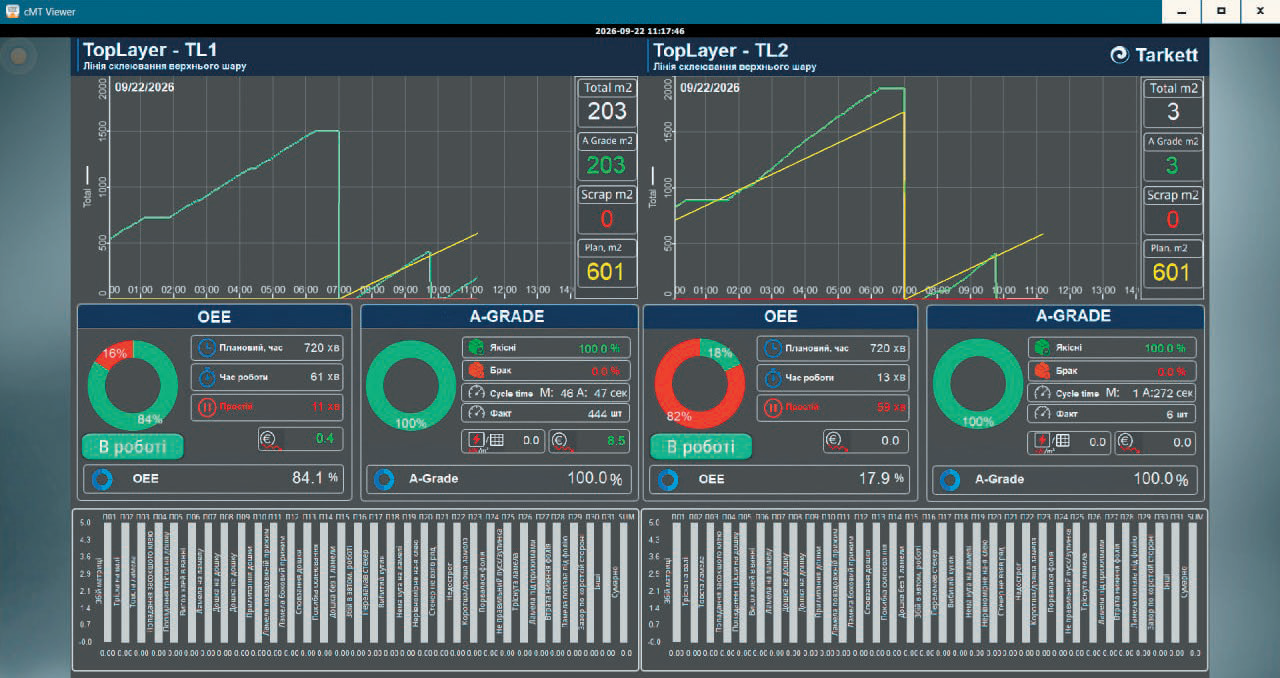
Fig. 1. Equipment efficiency and Smart Manufacturing dashboard
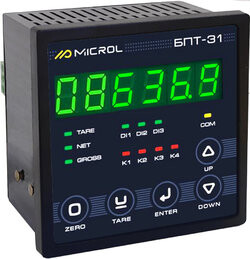
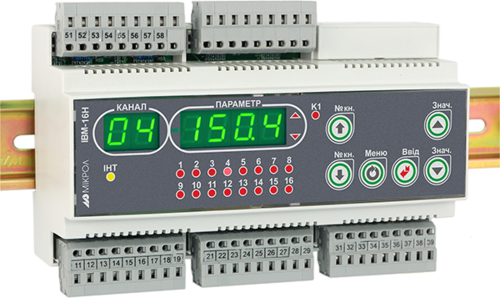
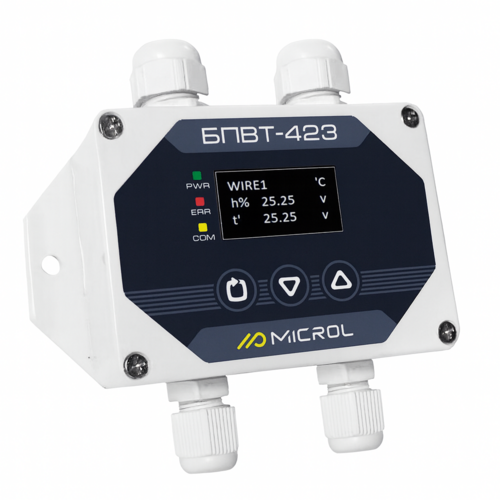
Microl manufactures a wide range of industrial automation products: controllers and regulators for process control, instruments for measuring electrical parameters, temperature and humidity, I/O modules, communication equipment and other devices for collecting, processing and transmitting process data.
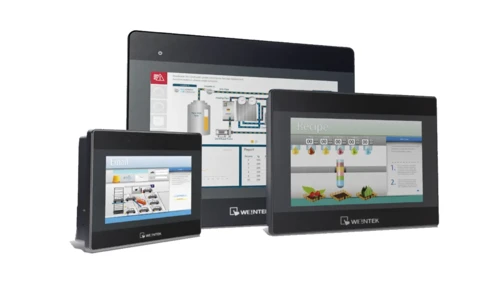
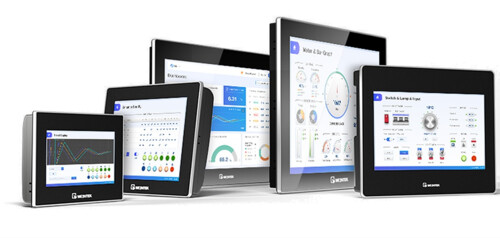
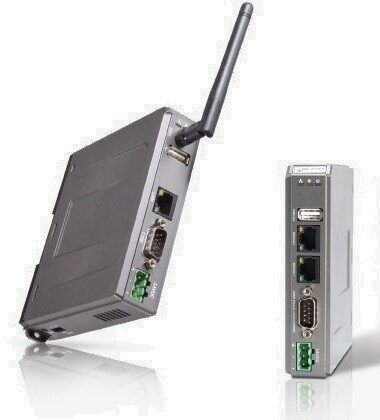
Weintek equipment provides the operator and software level of automation systems: process visualization, data collection, processing and archiving, remote access and IIoT functions. CODESYS-enabled panels additionally allow PLC logic and calculation algorithms to run directly on the HMI device.
Sales representation and supply of Weintek equipment in Ukraine are provided by Microl TD LLC, Ivano-Frankivsk.
Tarkett Vinisin LLC is an industrial enterprise in Kalush, Ivano-Frankivsk region, and part of the French international group Tarkett. Its main business is the production of floor coverings for residential and commercial use.
The company chose a path of gradual automation and digitalization — from simple local systems to comprehensive monitoring and production analytics. Instead of a full modernization all at once, individual systems are introduced one after another, each solving a specific task and laying the groundwork for the next stage. This makes it possible to spread investment over time and make maximum use of the infrastructure already in place.
Three main projects have been implemented:
The first project was a system for continuous monitoring of temperature and relative humidity in production and storage areas.
Nine temperature and relative humidity measurement points were set up (Fig. 2). The system collects and archives data in real time and responds automatically when parameters go beyond the set limits.
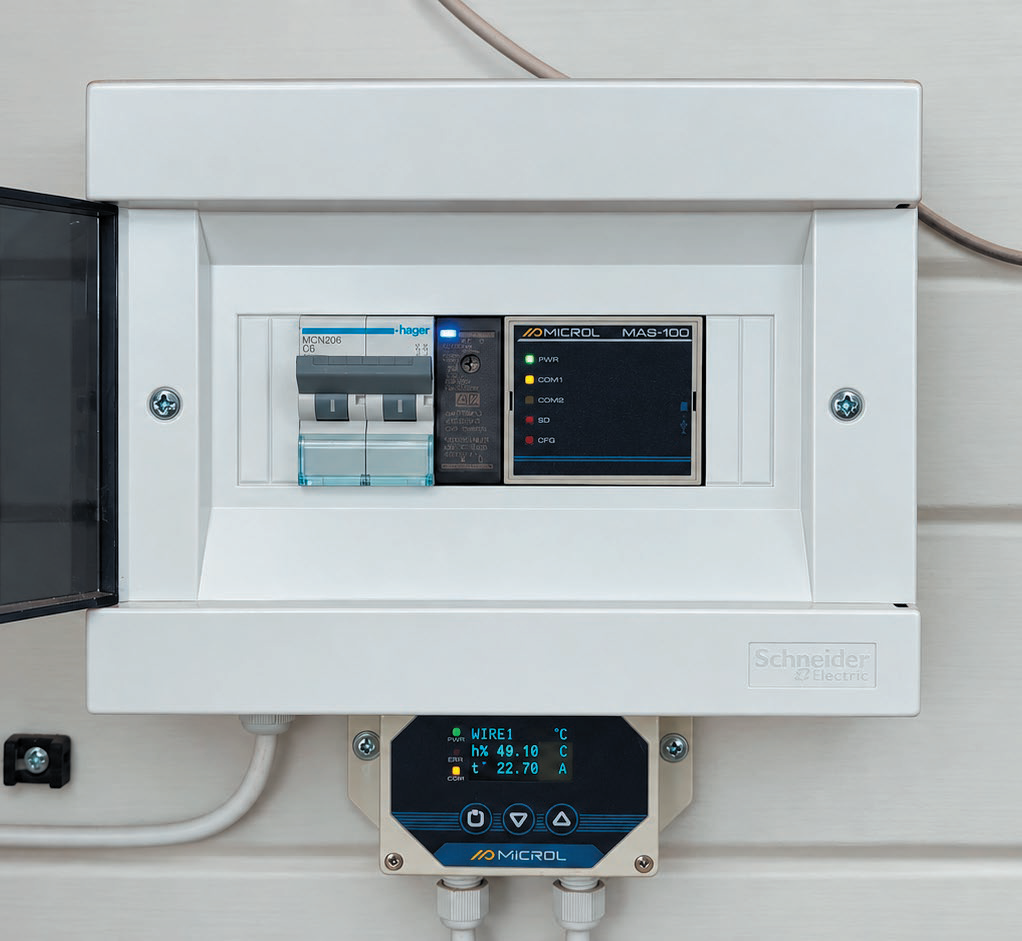
Fig. 2. Humidity and temperature measurement point
The system uses:
Besides displaying current values, the system processes the data in software, including calculation of equilibrium moisture content and weighted average parameters (Fig. 3).
This is especially important for woodworking, since wood is a hygroscopic material. A weighted average temperature describes the conditions the material has been exposed to over a long period better than a single instantaneous reading. Combined with relative humidity, it makes it possible to assess the conditions affecting the wood's moisture content, shrinkage, swelling and dimensional stability.
The cMT3102X with CODESYS processes measured values, performs calculations, checks permissible limits and generates alarm states. In this way, the panel acts as both an HMI and a programmable controller (Fig. 3).
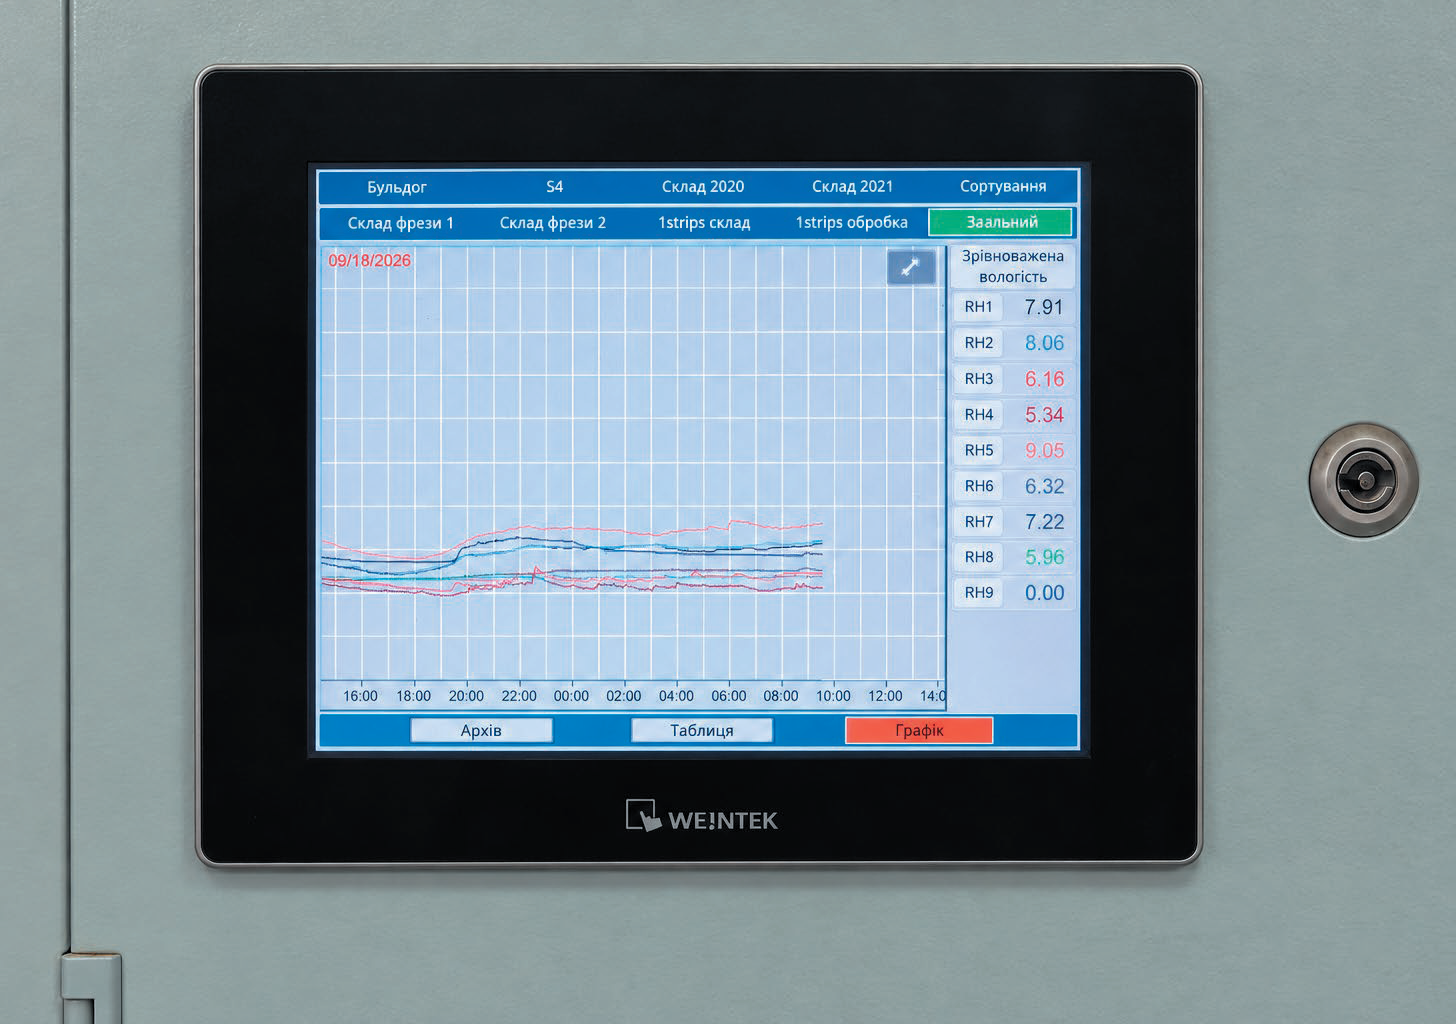
Fig. 3. Humidity and temperature trends on cMT3102X
When temperature or humidity goes beyond the set limits, the system generates an alarm. Responsible staff can receive push notifications and e-mail alerts. Remote viewing of parameters is also available.
As a result, the company now has a continuous automated microclimate monitoring system with archiving, calculation functions and deviation alerts.
The next stage was a system for individual monitoring of power consumption and electrical network parameters of production equipment.
Twenty-five monitored loads are connected to the system.
The system uses:
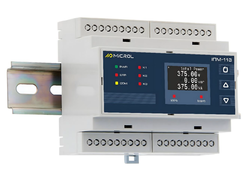
The IPM-103 meters measure voltage, current, frequency, active, reactive and apparent power, as well as power factor (Fig. 4).
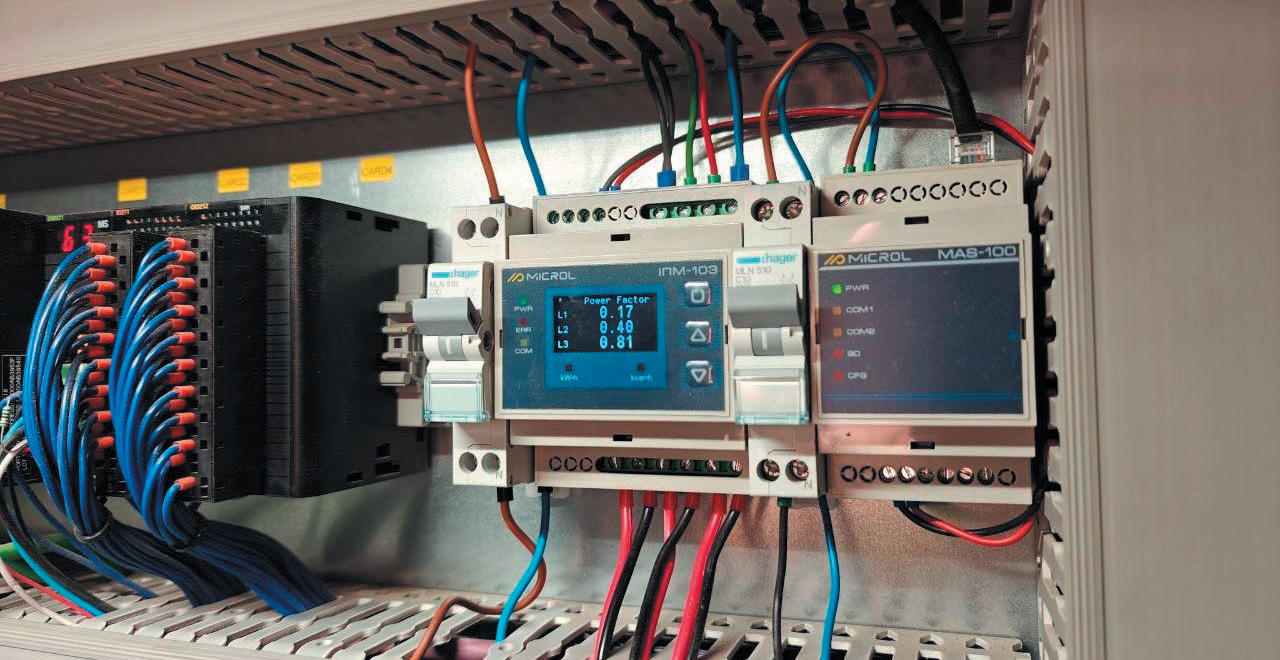
Fig. 4. Electrical energy measurement point
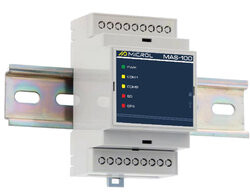
Data is transferred to the cMT-FHDX820 via RS-485/Modbus RTU, the MAS-100 modules and the local network.
For each connected load, the following can be analyzed:
Monitoring power consumption during downtime is especially important. Equipment may not be producing anything yet still keep consuming electricity. Individual monitoring makes it possible to detect such unproductive consumption (Fig. 5).
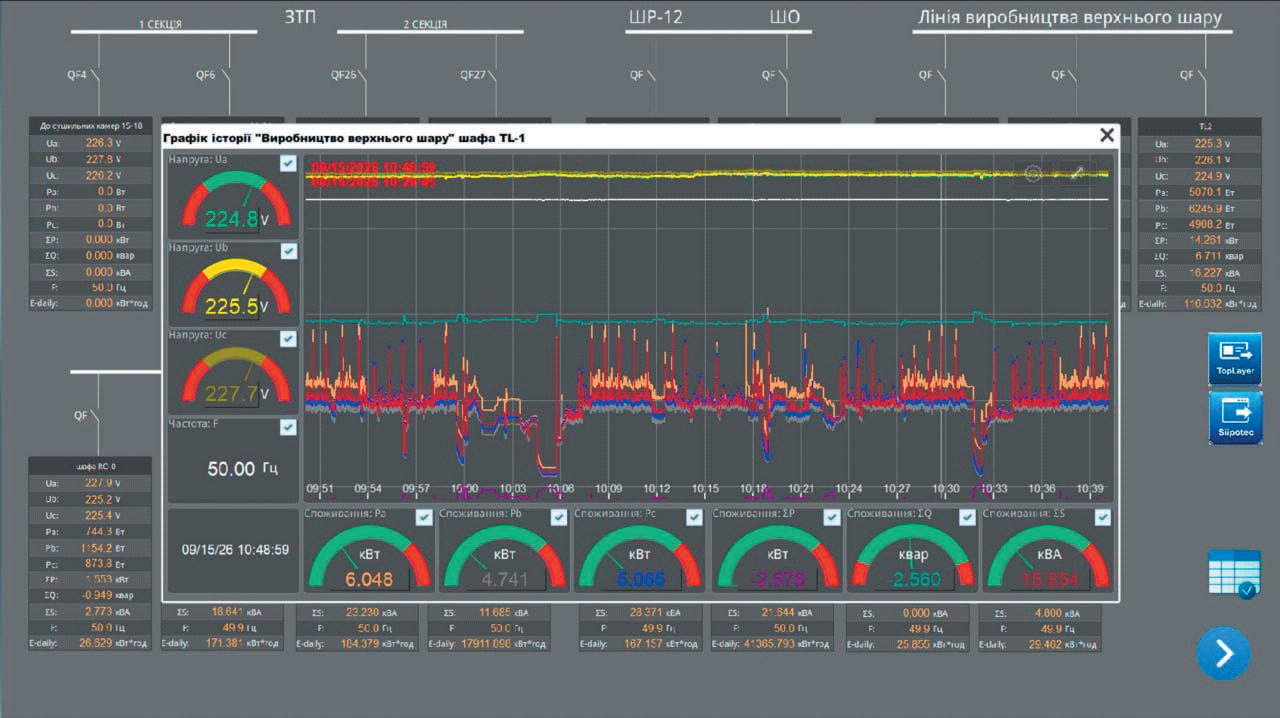
Fig. 5. Power consumption visualization in Weintek cMT Viewer
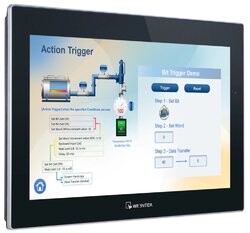
The Weintek cMT-FHDX820 (Fig. 6) serves as the system's central HMI/IIoT device. It handles data collection, archiving and visualization, viewing of current and historical values, and building of mimic diagrams and dashboards.
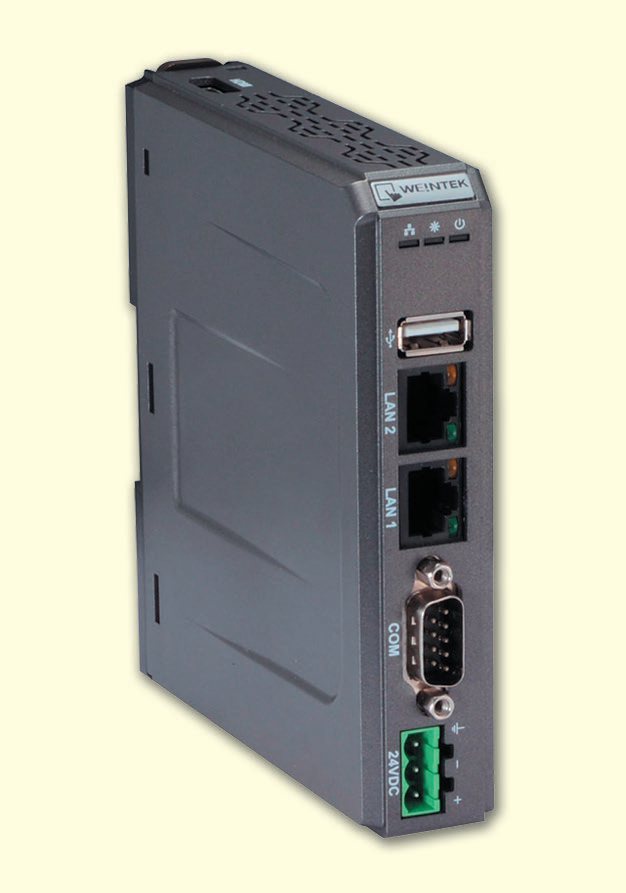
Fig. 6. Weintek cMT-FHDX820
The HMI project is created in Weintek EasyBuilder Pro, and cMT Viewer is used for remote access.
EasyBuilder Pro is Weintek's free software environment for creating HMI projects, mimic diagrams, trends, alarms, archives and operator interaction tools. Creating and expanding HMI projects does not require purchasing a separate development license.
Thus, a local supervisory level has been built on the cMT-FHDX820, making it possible to analyze equipment operating modes and detect unproductive power consumption.
The most comprehensive stage of automation was the creation of a system for monitoring the actual operation of production machines. The main goal was to obtain reliable information on how much time the equipment actually runs, how long it stands idle, why stoppages occur, how much product is made, what its quality is, and how efficiently the equipment is used during a shift.
An important requirement was that the new system must not interfere with the regular machine control. It was therefore implemented as a parallel loop for collecting and processing production information: it receives the necessary signals from the equipment but does not change its basic operating algorithms.
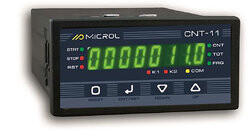
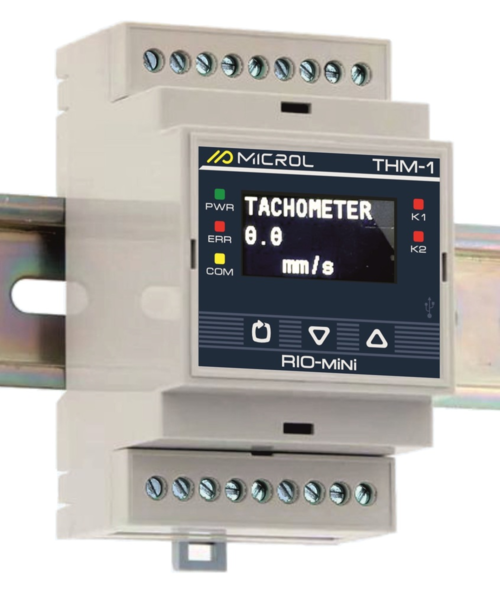
Primary data is collected with Microl CNT-1, IPM-1N, THM-1 and RIO-mini DI8 devices (Fig. 7):
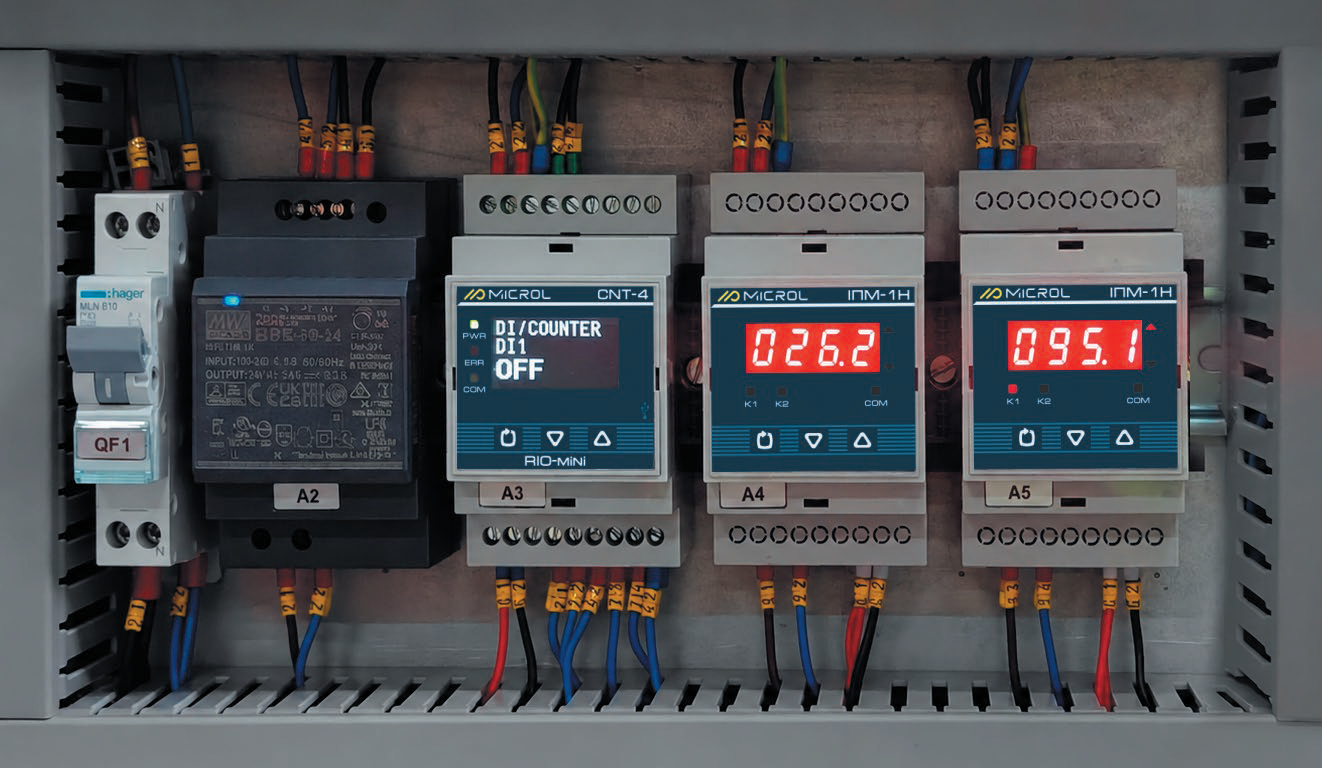
Fig. 7. Production data acquisition and processing loop
All collected data is sent to a Weintek cMT3162X HMI with CODESYS Runtime. In this project, the cMT3162X is used not only as an operator panel but also as a platform for running program logic and calculation algorithms.
The CODESYS application determines run time and downtime, accumulates shift statistics, classifies downtime reasons, counts products, tracks good and defective output, and calculates productivity, OEE, AGrade, specific energy consumption, operating hours, motor life and economic indicators.
In this way, Microl devices form the primary production data acquisition level, while the cMT3162X with CODESYS handles data processing, KPI calculation and operator visualization (Fig. 8).
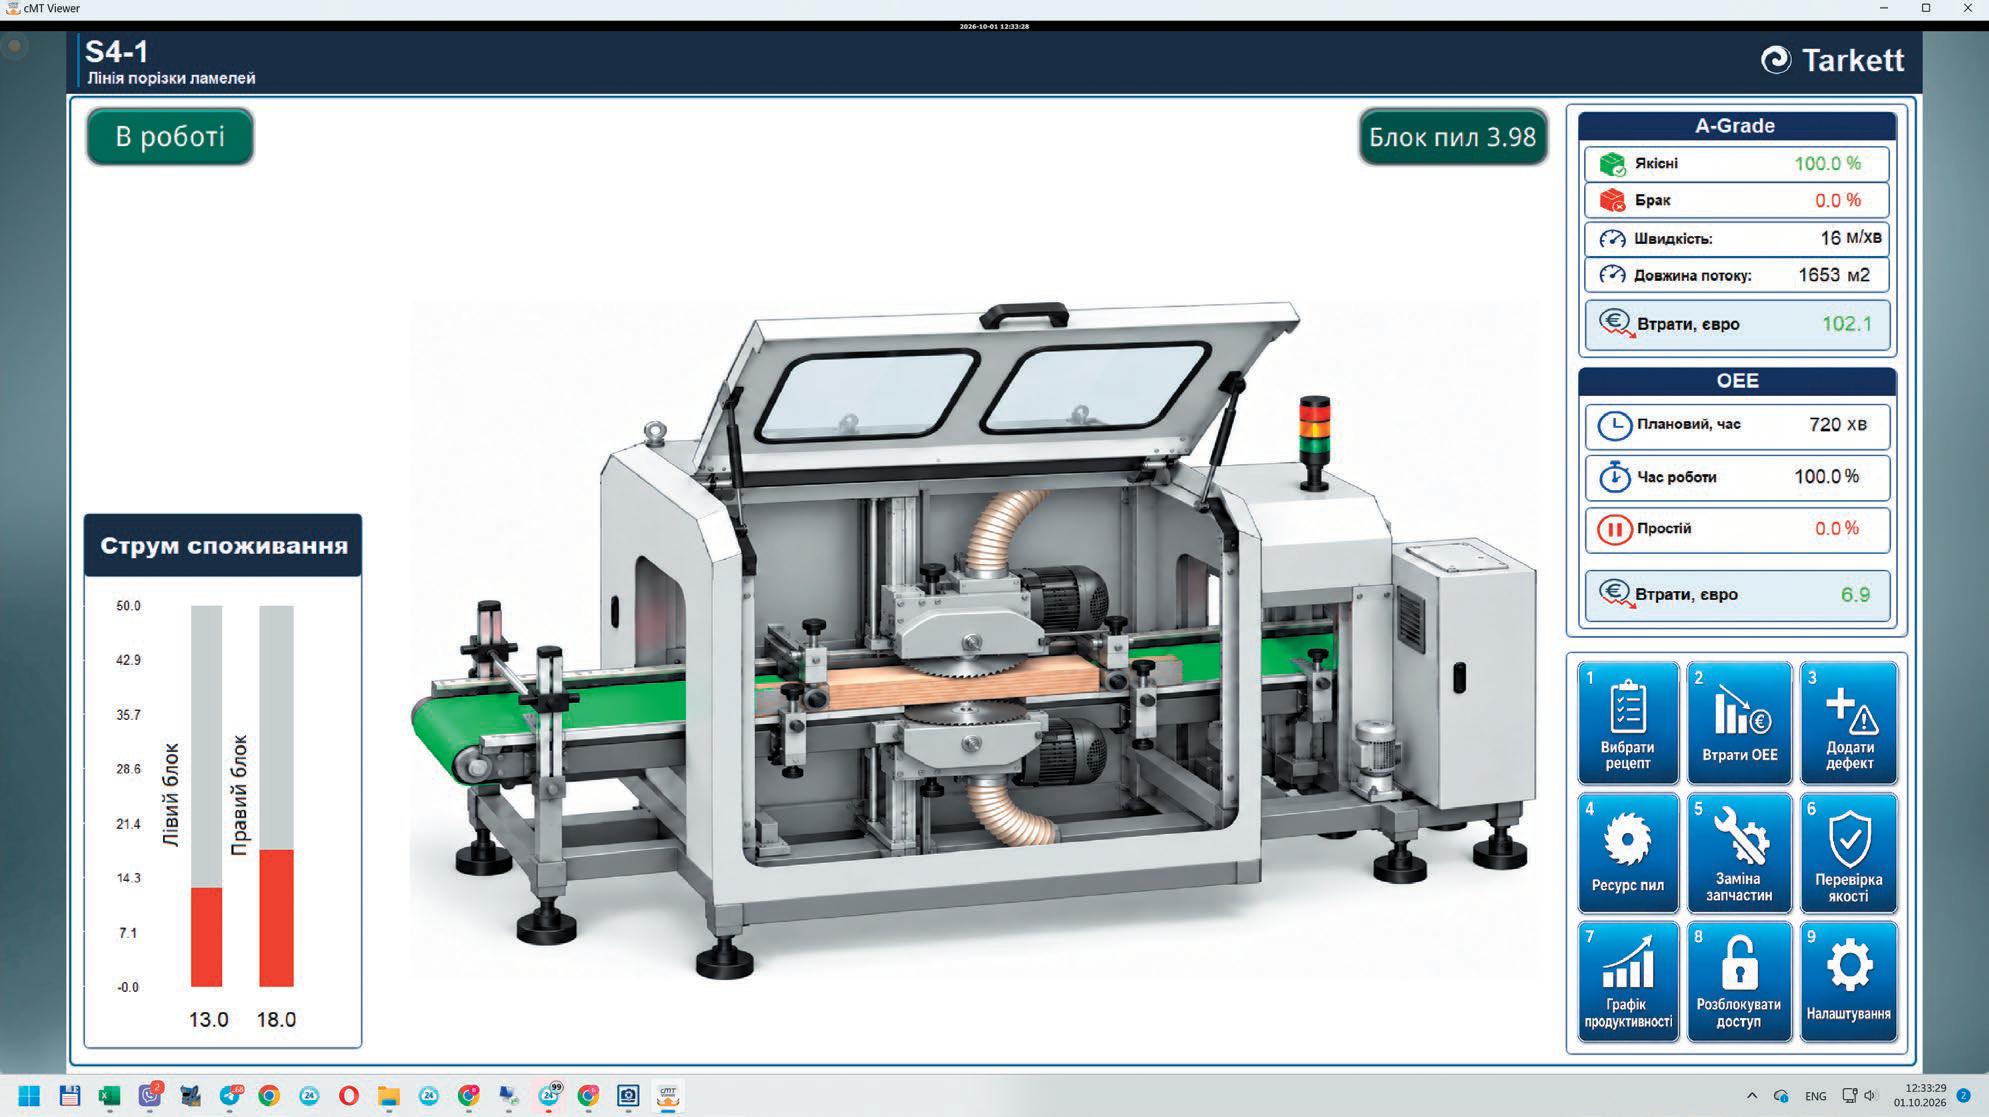
Fig. 8. Machine operator screen
The plant operates in 12-hour shifts. Once a shift starts, the system automatically accumulates statistics and identifies periods of productive operation and downtime.
For each shift, the system calculates productive time and downtime, actual productivity, the quantity of products made, the quantity of good and defective products, and power consumption. The figures are updated throughout the shift, so operators and management see not only the final result but also the current state of production.
At every stoppage, the system automatically records the start and duration of the downtime, and the operator can select its reason. Up to 15 categories of time loss are provided, including changeovers, waiting for material, process stops, maintenance, repairs, operator absence, waiting for upstream or downstream operations, and other organizational or technical reasons.
As a result, the system shows not only the total downtime but also the structure of production losses, which makes it possible to identify the main causes of unproductive time.
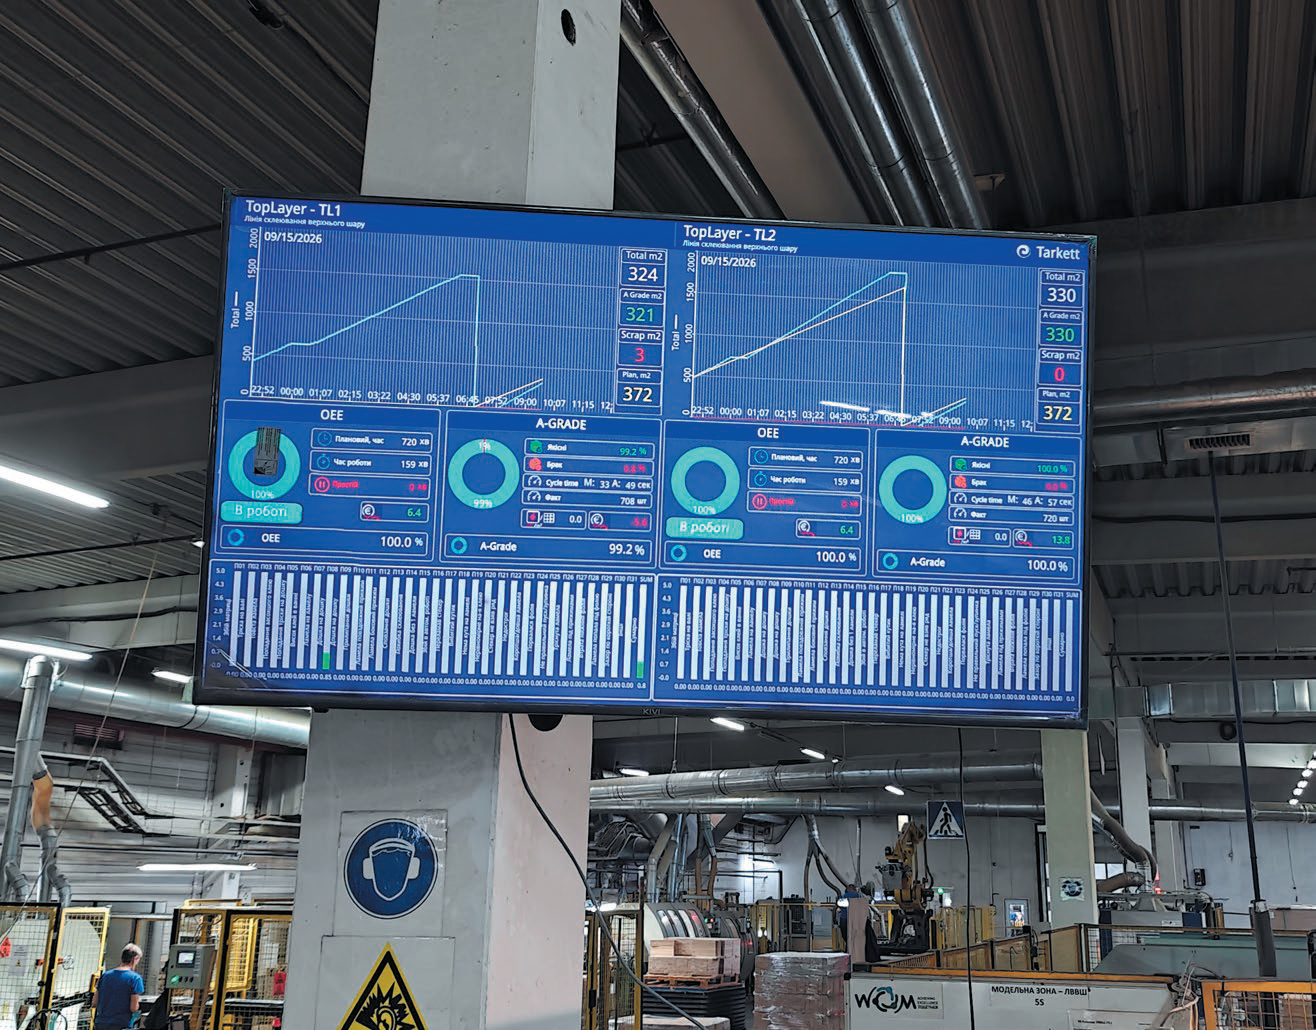
For real-time control, the key figures of the current shift are also shown on a large TV screen (Fig. 9) installed right on the shop floor. Staff can see productivity, plan fulfillment, product output, productive time, downtime, OEE and quality indicators in real time. This makes it possible to respond to deviations during the shift itself.
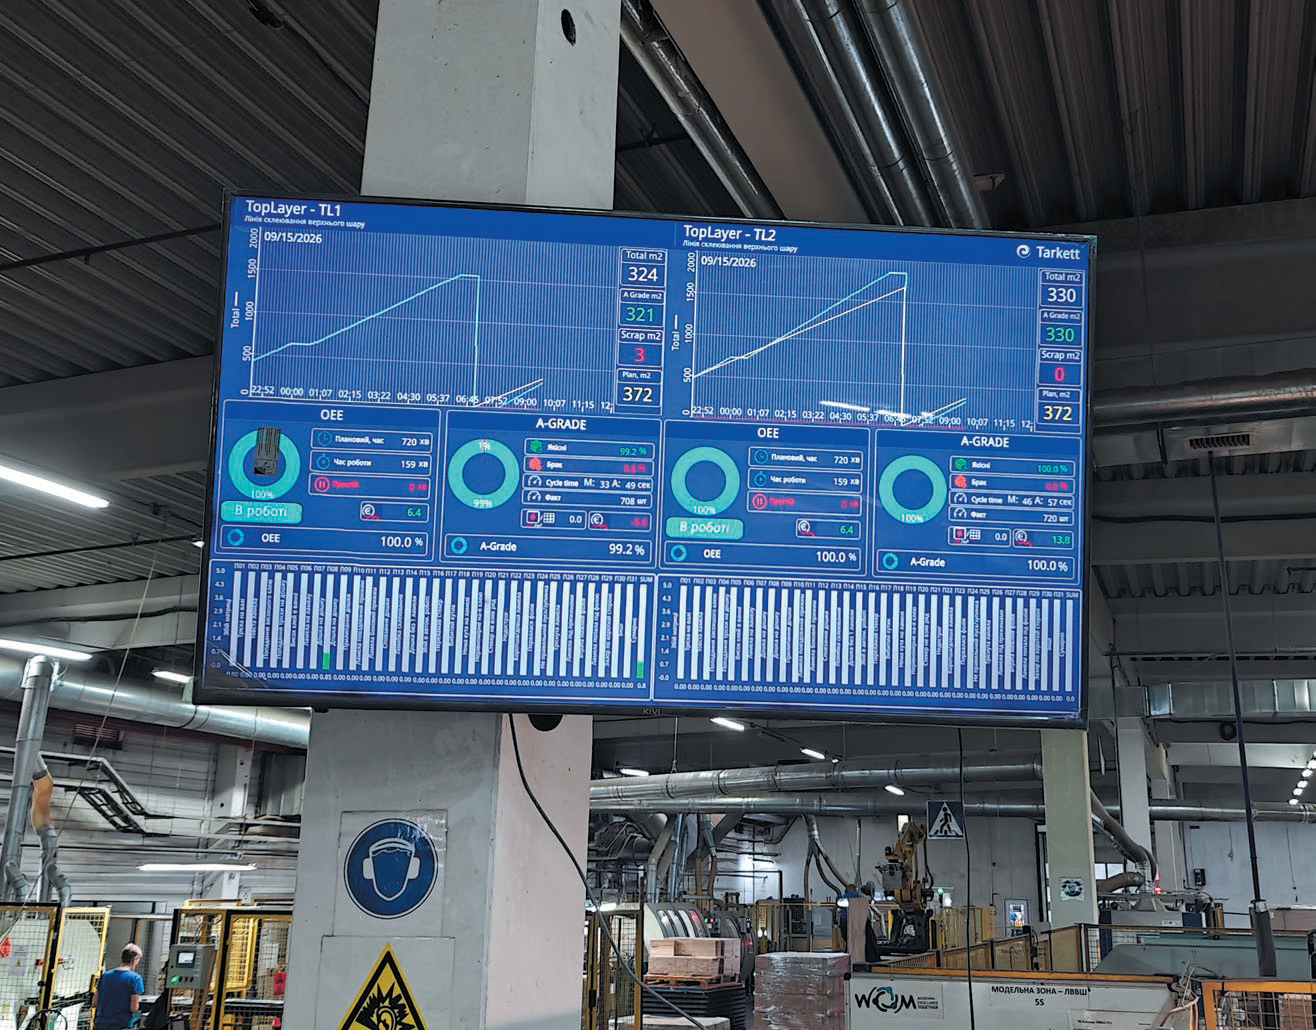
Fig. 9. Shop-floor screen showing real-time shift performance
In parallel, the system keeps records of product quantity and quality. It separately logs total output, good and defective products, defect types, the percentage of good products and the scrap rate (Fig. 10). The AGrade indicator is used for an additional assessment of good product yield.
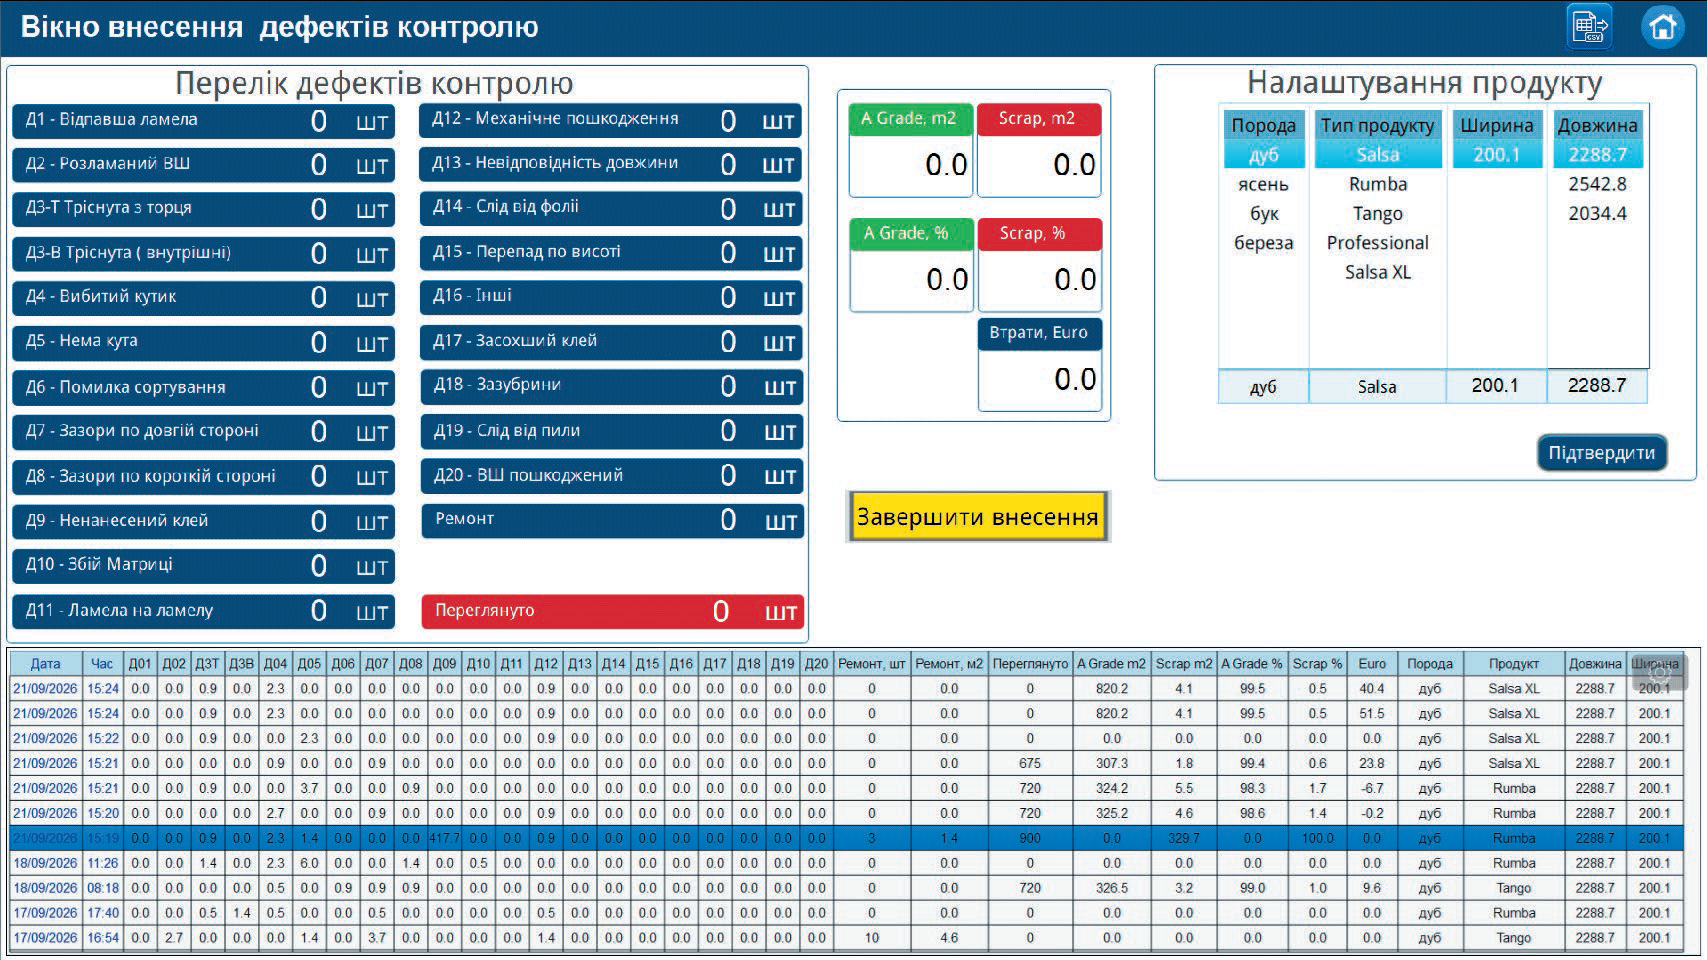
Fig. 10. Quality defect entry screen
Based on the accumulated data, the system automatically calculates OEE (Overall Equipment Effectiveness) (Fig. 11), which takes into account three main components:
availability × performance × quality
This gives a comprehensive view of equipment efficiency. High operating speed on its own does not guarantee a good result if the equipment frequently stands idle or produces a large amount of defective output.
OEE is calculated throughout the shift, allowing the actual efficiency of equipment use to be assessed promptly.
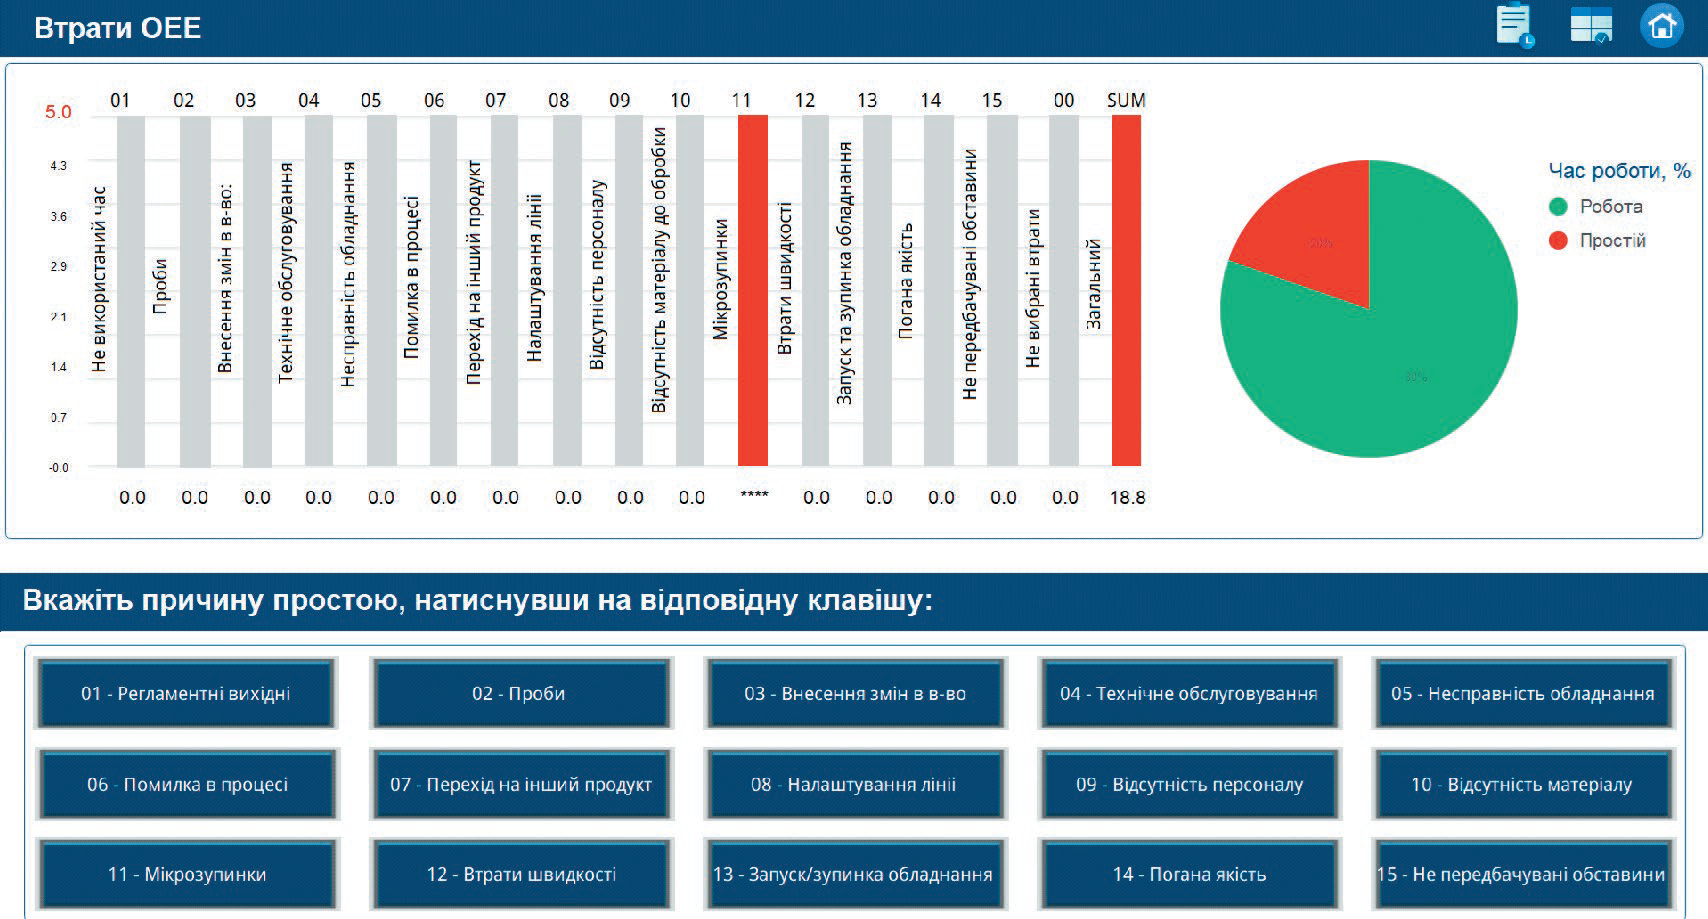
Fig. 11. OEE (Overall Equipment Effectiveness) calculation screen
Production indicators can also be converted into financial terms, for example: downtime → lower productivity → output shortfall → financial loss.
Likewise, when planned targets are exceeded, the system can show a positive economic result.
Combining power consumption data with the actual output of good products makes it possible to calculate kWh per unit of good product. This indicator reflects not just overall electricity consumption but the real energy efficiency of the production process.
The system also tracks equipment operating hours and motor life, identifies operators, archives key indicators, exports data to Microsoft Excel and provides remote access to information (Fig. 12).
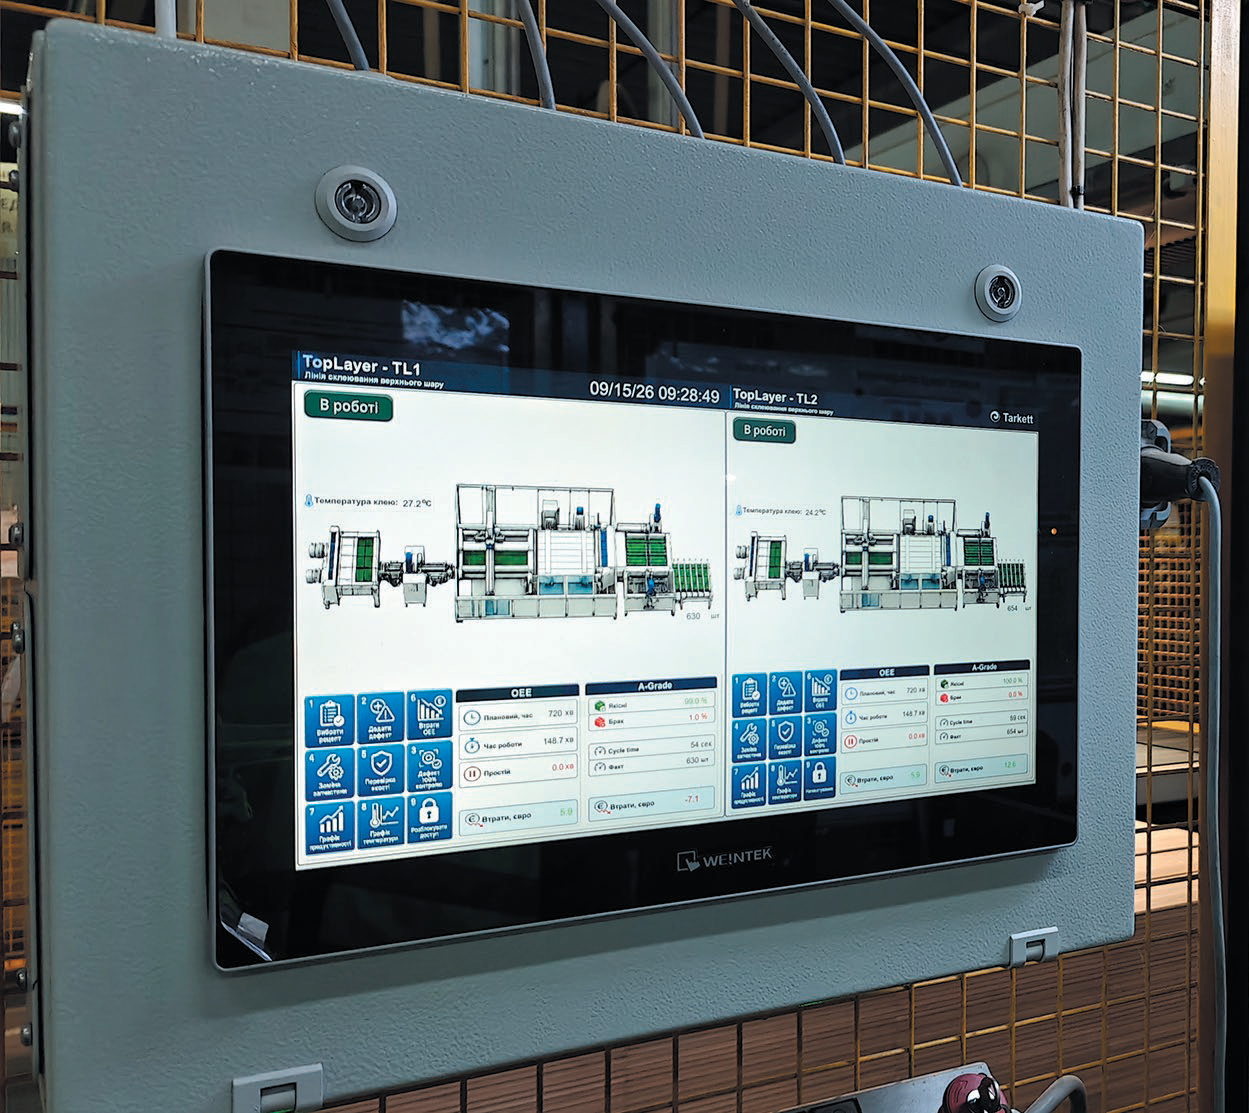
Fig. 12. Process visualization on Weintek cMT3162X
As a result, the company has a unified monitoring system that brings together data on equipment operation, downtime, productivity, quality, energy consumption and economic results.
The next stage in the system's development is to centralize production data in Microsoft SQL Server and use Microsoft Power BI for further analysis and visualization.
The unified database can receive data on the microclimate, energy consumption, equipment operation, downtime and its causes, productivity, product output and quality, OEE, AGrade, motor life and operator activity.
Microsoft SQL Server will serve as the central repository of production information, and Power BI as the tool for building analytical models, reports and interactive dashboards.
Reports and dashboards can be created in the free Power BI Desktop, which makes it possible to start production analytics with minimal upfront software costs.
Many of the functions already implemented — equipment monitoring, production accounting, downtime and quality analysis, OEE calculation, monitoring of energy consumption and other production indicators — are tasks that MES systems also address. At the same time, deploying a full-scale MES can require significant investment in software, integration, server infrastructure and ongoing support.
The chosen step-by-step approach based on Microl, Weintek and CODESYS allows the company to implement the functions it needs gradually, building on the existing infrastructure and expanding the system as production requirements grow. The accumulated data and existing data channels can later be used for integration with an MES or other enterprise information systems.
This approach delivers practical results at every stage of digitalization, keeps investment under control and gradually builds a unified information environment for production.
For more information about the products mentioned in this article, please contact Microl LLC:
+38 (0342) 502-701
+38 (067) 359-70-90
+38 (095) 092-07-28
sale@microl.ua, microl_zbut@microl.ua, zbutmicrol@gmail.com
www.microl.ua
or the representative office of Weintek Labs., Inc. in Ukraine:
+38 (067) 359-70-90
+38 (095) 092-07-28
sale@weintek.in.ua
www.weintek.in.ua
Technical support:
+38 (0342) 502-702
+38 (067) 704-00-29
+38 (095) 302-37-57
support@microl.ua, supmicrol@gmail.com