0
0
 0
0
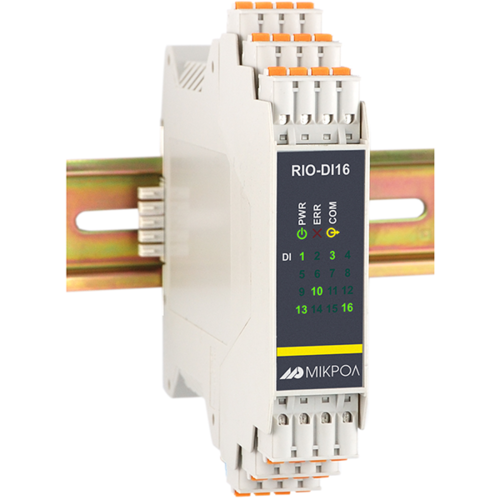
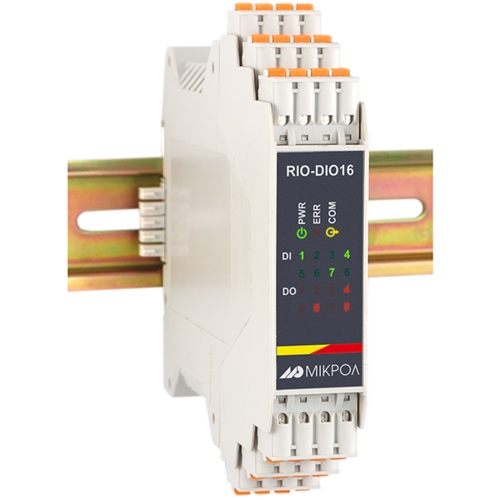
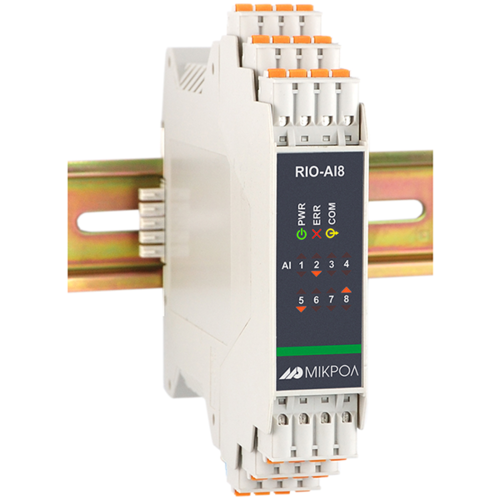
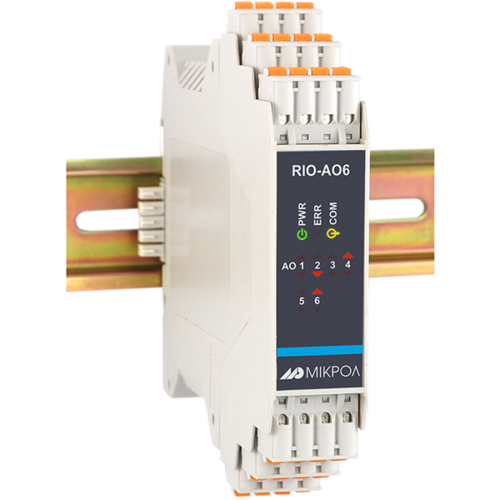
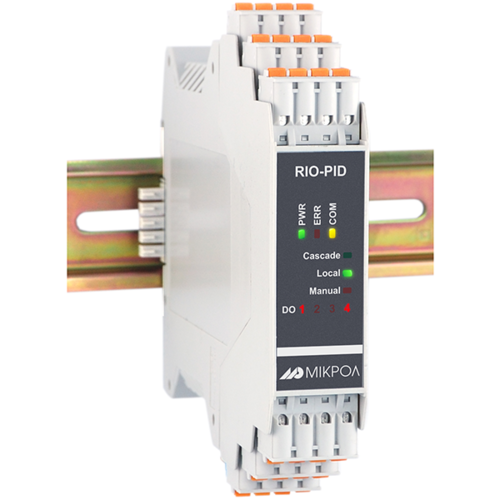
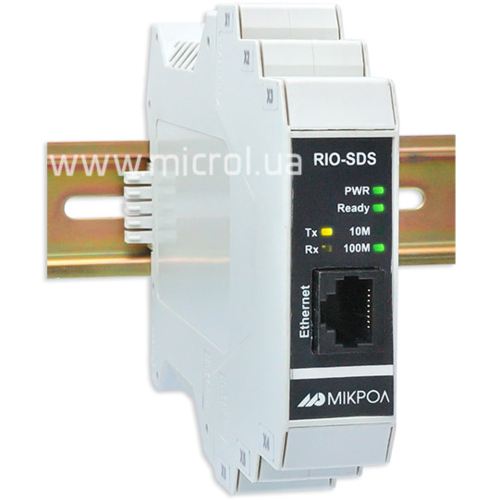
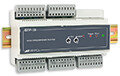
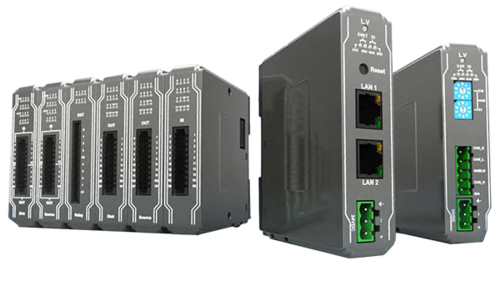
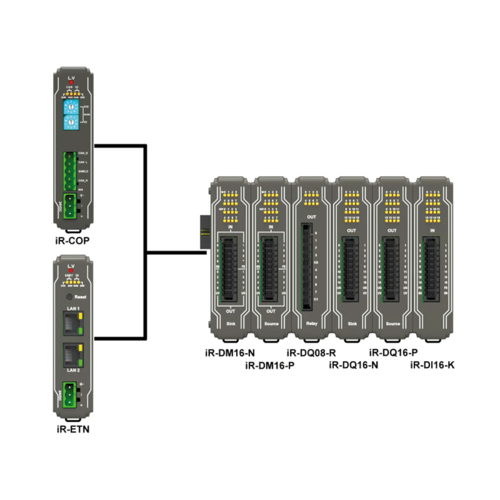
I/O modules
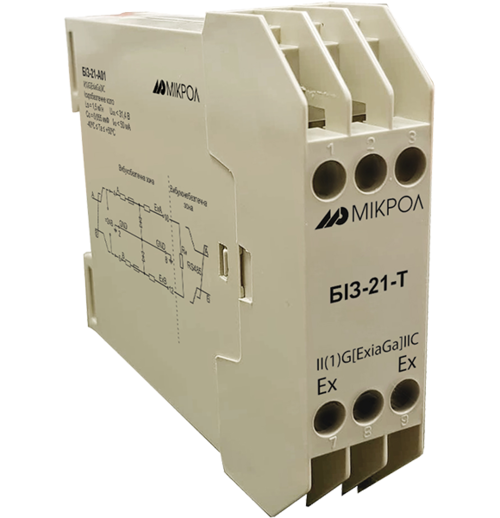
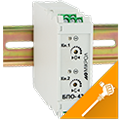
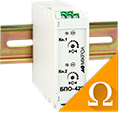
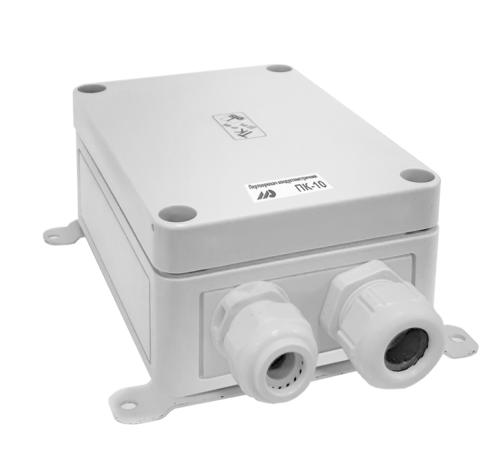
Spark protection barrier
Recorders and archivers
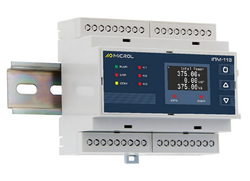
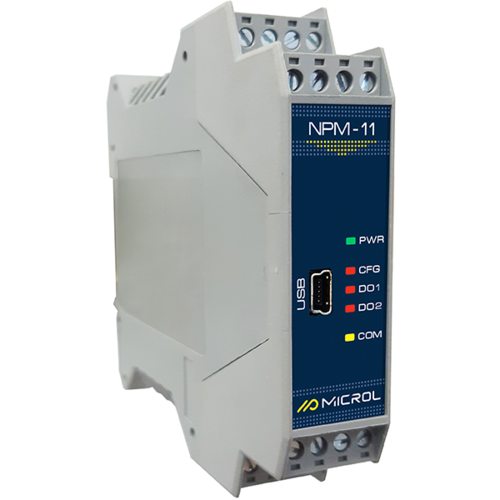
Meters and converters of electrical network parameters
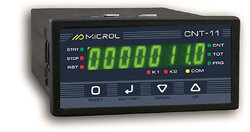
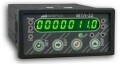
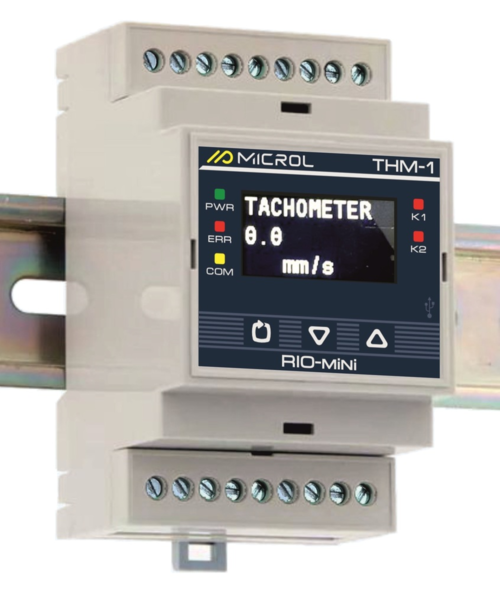
Counters, timers, tachometers
Liquid level indicators and regulators
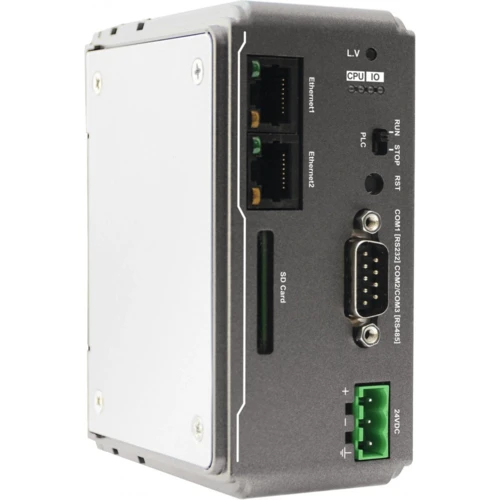
Programmed logical controllers
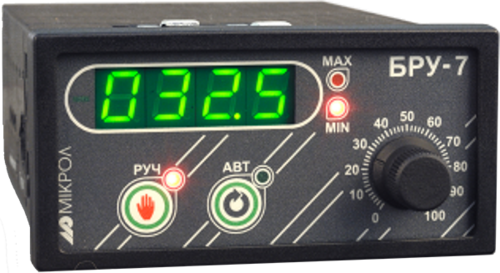
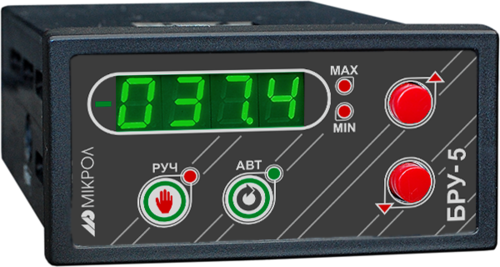
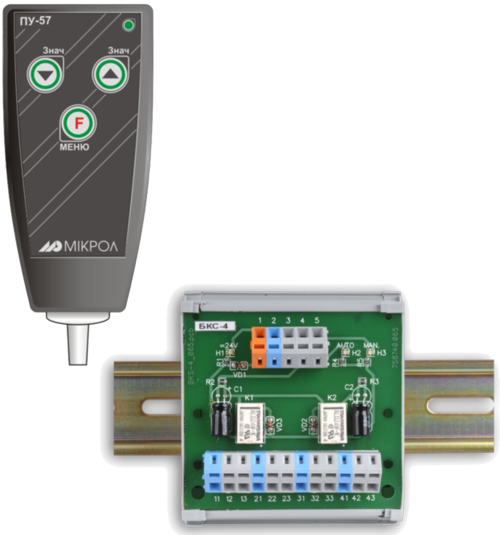
Manual signal transmitters
Technological signaling devices
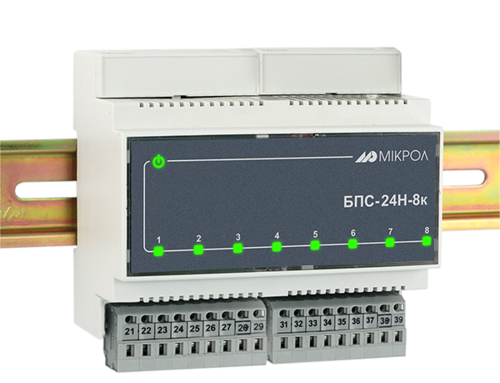
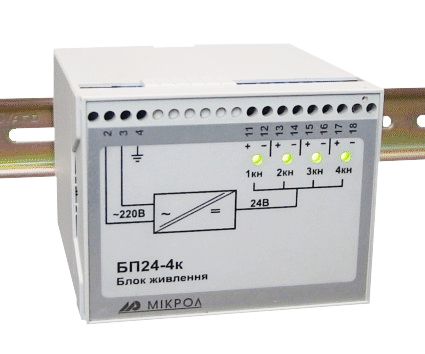
Power supplies
Codesys PLC controllers
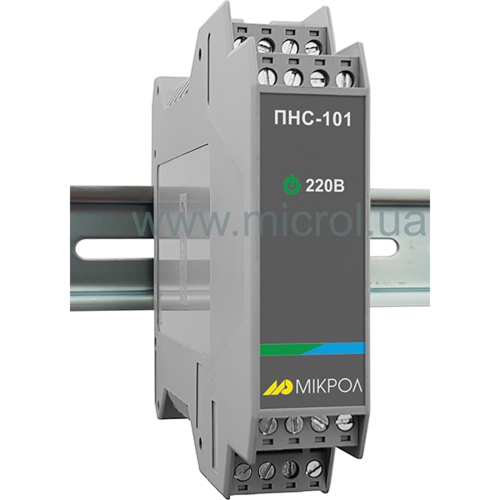
Normalizing converters
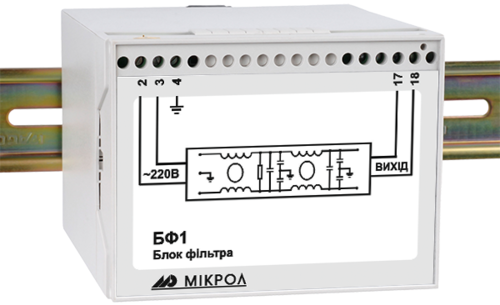
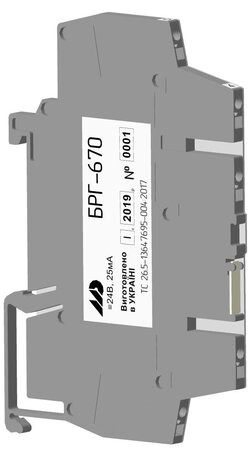
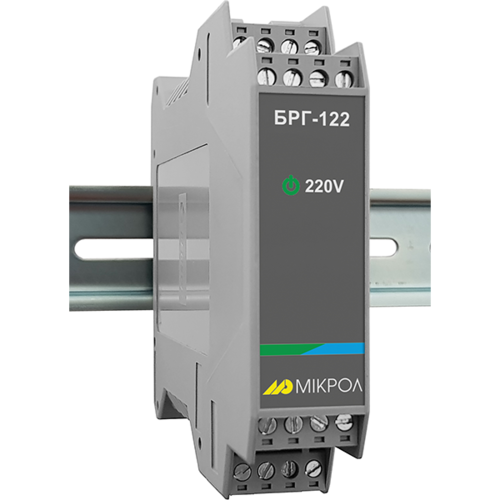
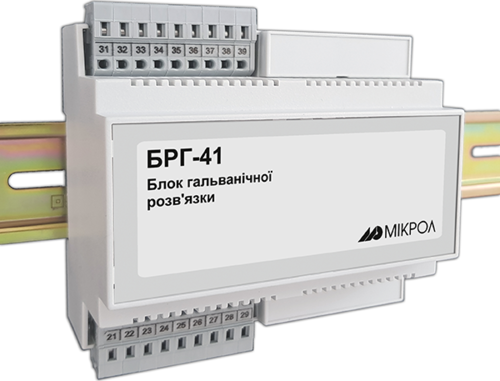
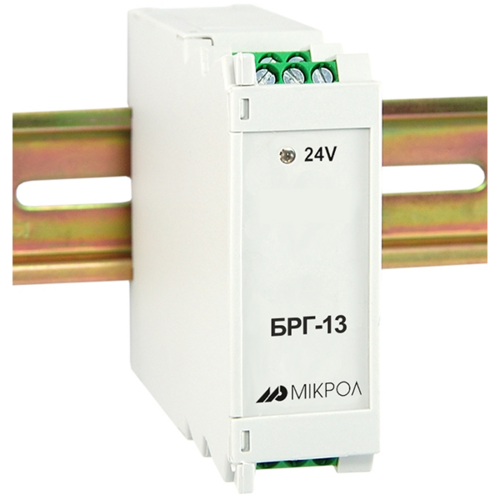
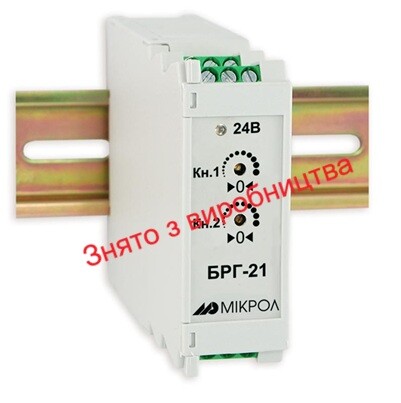
Galvanic isolation and branching blocks
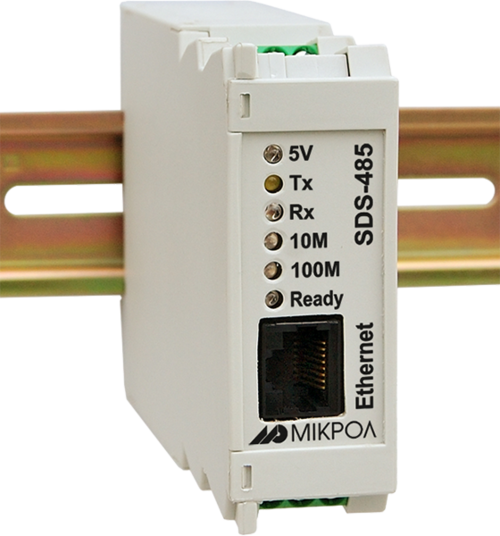
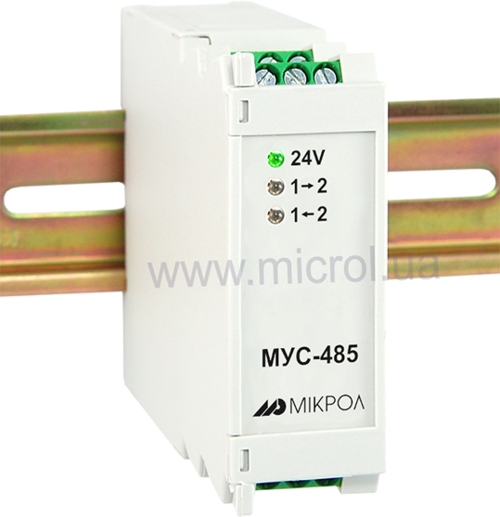
Communication interface converters and amplifiers
Analytical instruments
Switching blocks
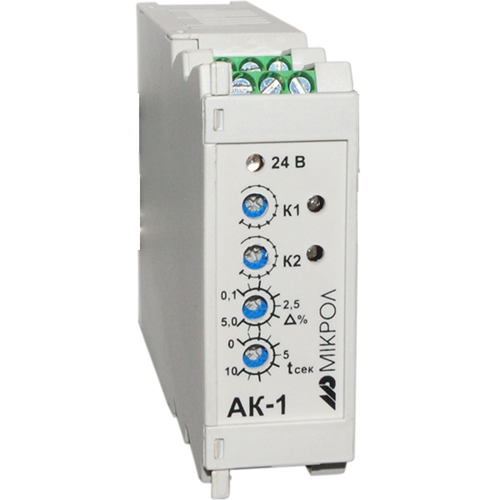
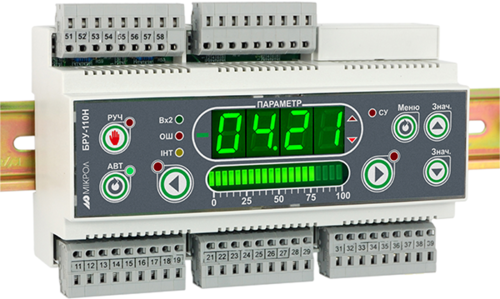
Control and protection units
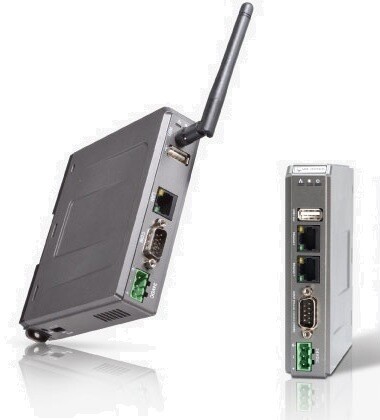
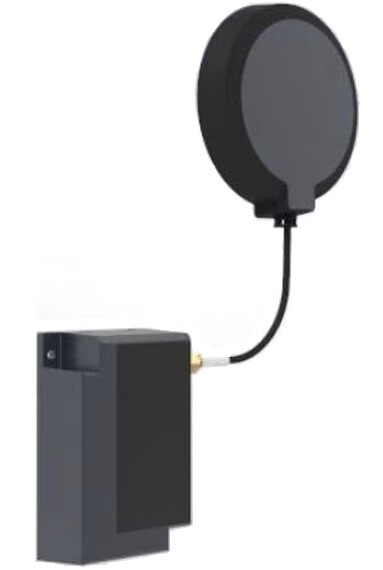
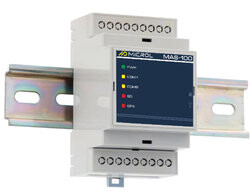
GSM communication routers / modems
News
10.02.2026
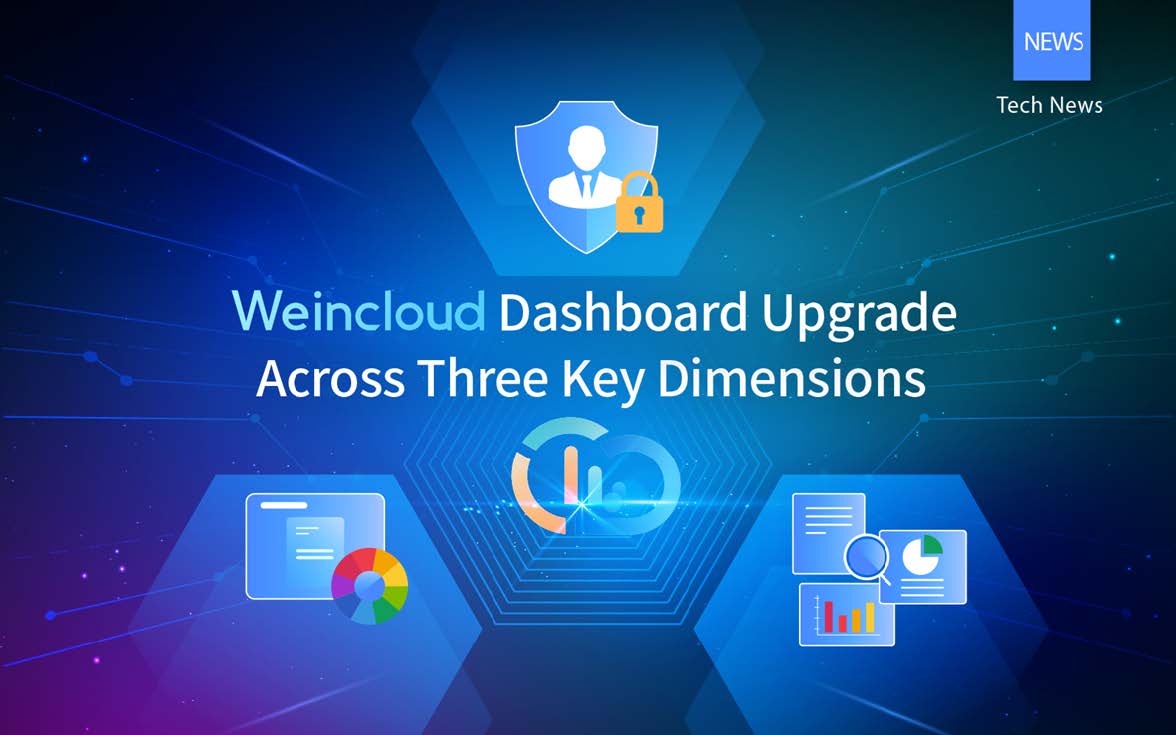

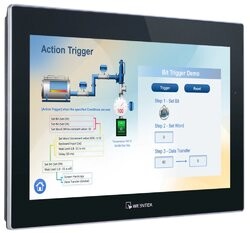
With the development of the Industrial Internet of Things (IIoT), enterprises' expectations for dashboards have changed. Today, it is no longer enough to simply see data; enterprises need to understand trends and accurately manage operations.
In 2025, Weincloud Dashboard introduced a number of significant updates. In addition to the improved UI/UX editing, several new practical features have been added. Let’s take a closer look at how Weincloud improves visualization, management, and data analysis — three key dimensions that together create a smarter enterprise monitoring system.
Previously, limited color options for software widgets made it difficult to align dashboards with corporate identity systems (CIS). With the version 1.4 update, administrators can now customize widget color schemes with greater flexibility. Different levels of data can be assigned different colors, which improves visual hierarchy and helps businesses create dashboards that better reflect their brand and operational needs.
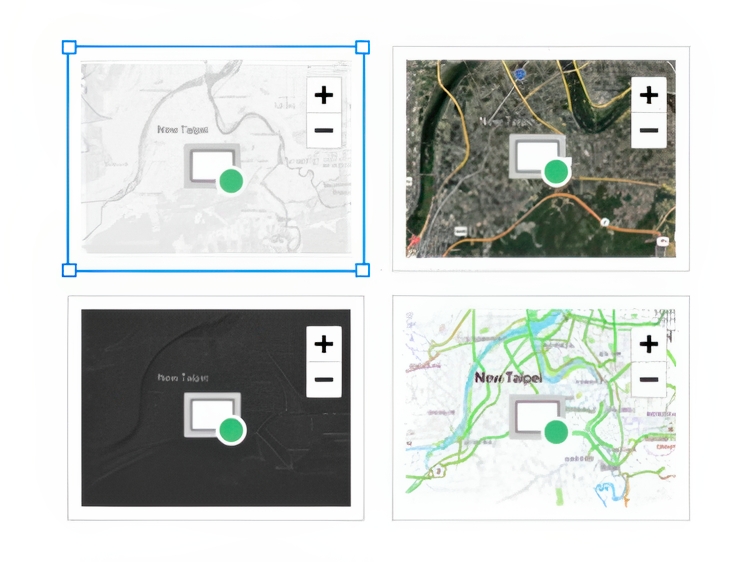
Widget «Map» supports multiple map modes — light, dark, street, and satellite — for various industry environments.
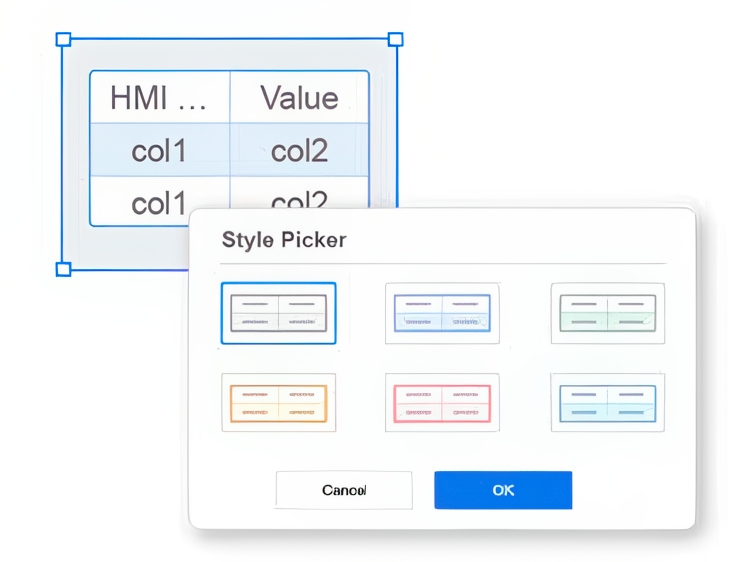
Widgets like «Tag History», «Alarm Display», «Table», «Options List» and «Counter», offer multiple style sheets for a consistent visual identity.
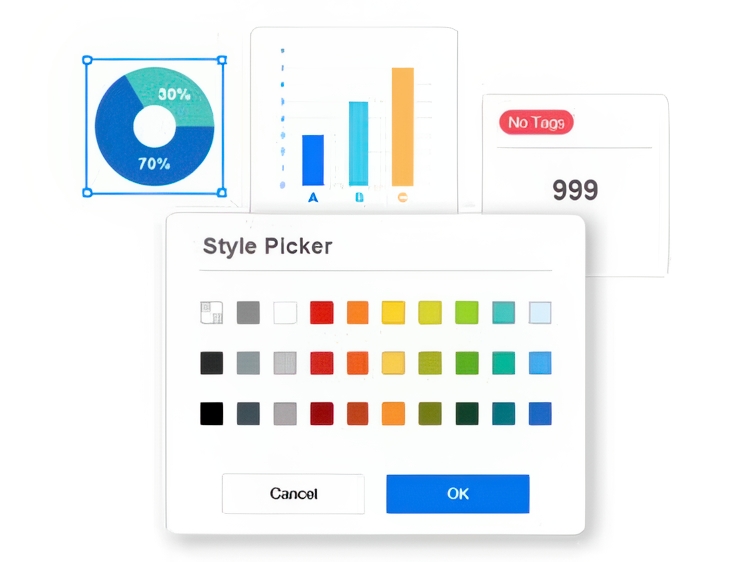
Colors can be customized for different elements of the widget, from separators values to XY axis labels in bar charts.
In previous versions, all users with viewing rights could see each widget after publishing the project. This update adds stronger security controls at the widget level, providing more granular access control.
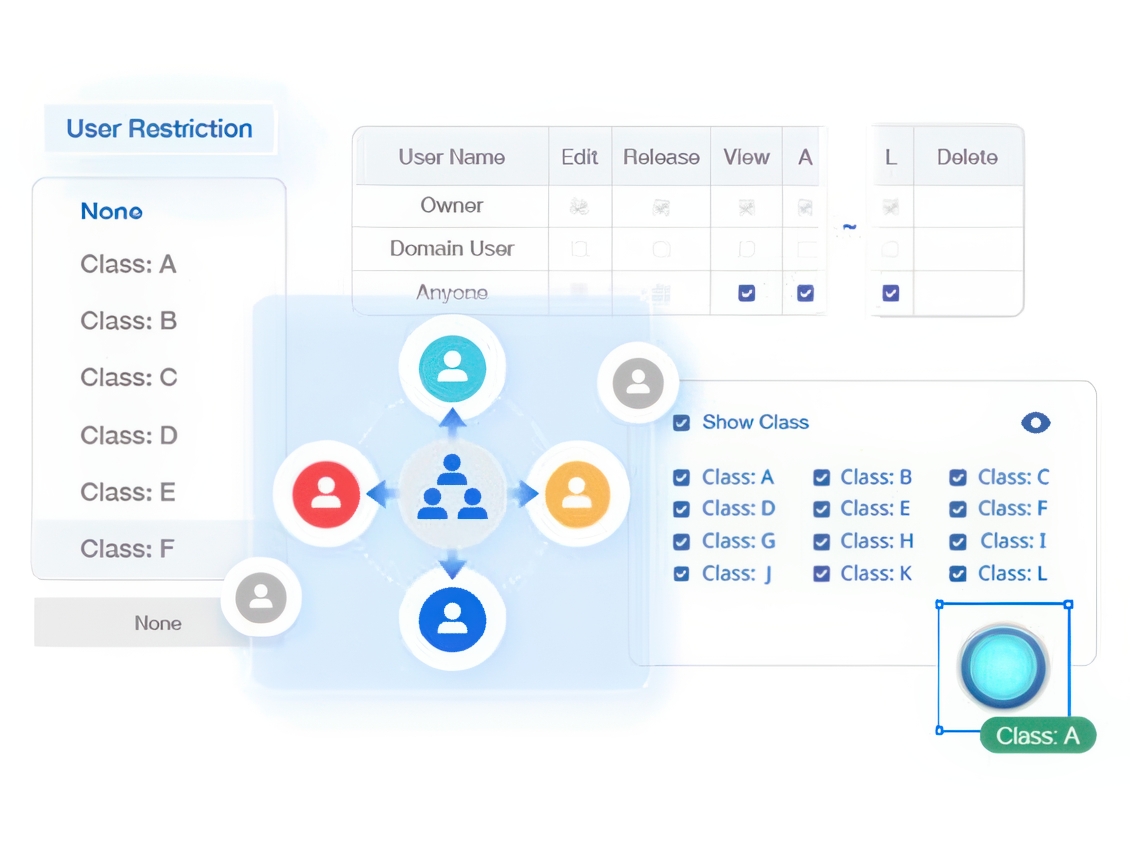
The User Restrictions setting in the properties panel allows you to assign each widget one of 12 categories (class A to L).
Centralized ManagementUnder «Settings» > «Project Permission», administrators can manage users, publishing and viewing rights in one place, and control access to each widget class.
Preview permissionsIn preview mode, administrators can toggle between permission views, select widget classes, and verify settings before deployment.
Traditionally, calculating total equipment usage across global assets required Excel exports or complex backend scripts. With the «Project Tags» feature in the dashboard, these calculations can now be performed in real-time directly on the frontend.
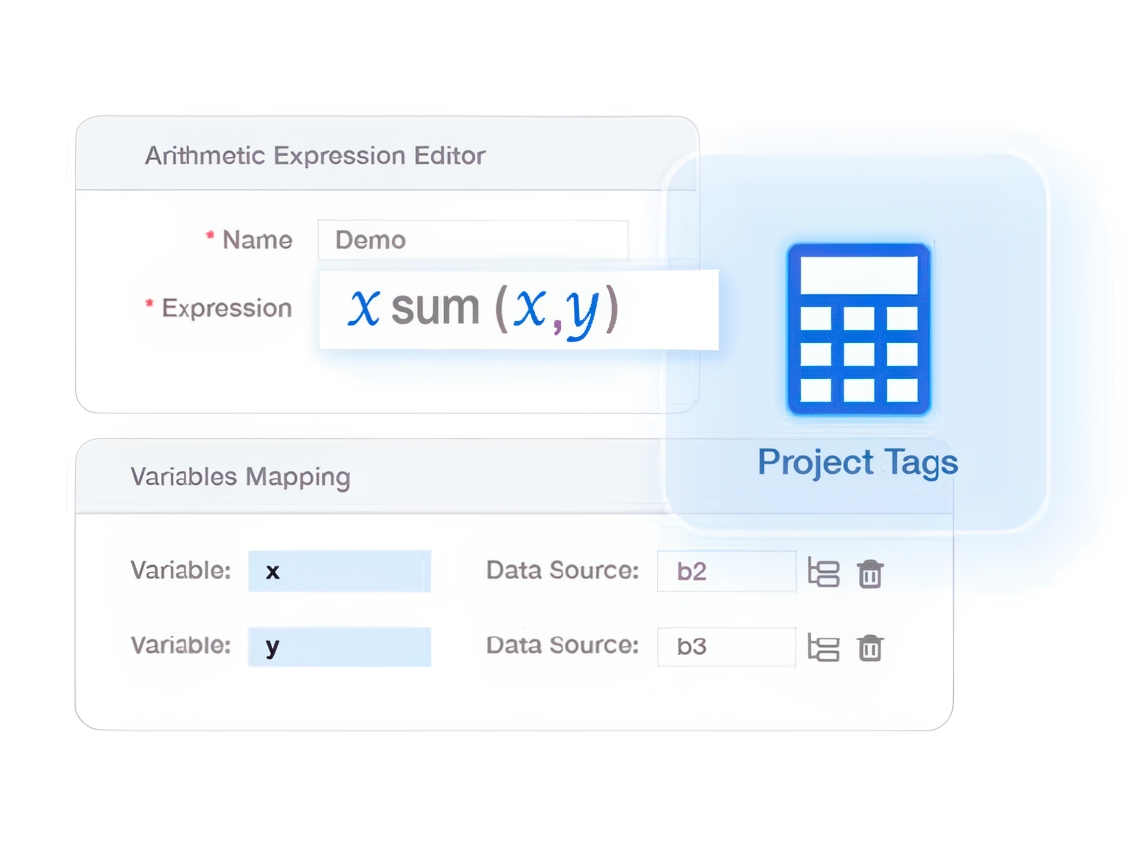
For example, HMI states such as normal operation, idle and abnormal conditions can be aggregated and presented in a pie chart. By creating a single project tag with defined variables and mathematical expression, the system automatically retrieves device data, performs calculations and displays the final values directly on the dashboard widgets.
For enterprises operating across multiple global sites, performing these calculations on the dashboard provides real-time visibility into equipment status, eliminating the need to wait for manual reports. Additionally, moving some of the calculation logic to the dashboard helps reduce the load on HMI and PLC devices, reducing the communication load on the overall control system.
About Weincloud Dashboard
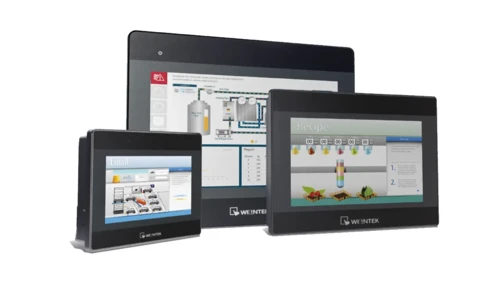
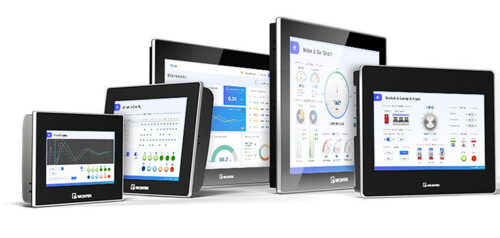
Weincloud Dashboard — is a cloud-based data visualization platform, is designed for industrial monitoring and remote control. It eliminates the high deployment costs of traditional monitoring systems, allowing enterprises to synchronize data from distributed HMIs and on-premises equipment with the cloud without servers or complex coding.
With a drag-and-drop editor, engineers can quickly create dashboards, and managers can monitor production anytime, anywhere using a smartphone, PC, or tablet, ensuring seamless integration of OT and IT.
Start using the dashboard today!
Sign up for Weincloud Dashboard now to take advantage of a 3-month free trial! Experience the powerful integration capabilities of Weincloud and create your own smart command center.
Open the booklet / download PDF